


To start from scratch, it is best to get used to working with Excel to develop your own graph and create your very own masterpiece in brick stitch … the sky is the limit. Have fun!
Starting a graph in Excel:
open an Excel document and change the dimensions of the cells as follows:
- at the top, click on “Home” which is next to “File”
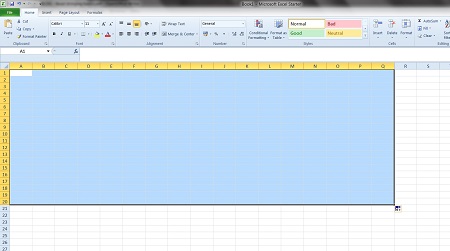
- click on the first cell at the top and drag the handle (the dot at the bottom) horizontally from A to Q and vertically from 0 to 20
- this working space will turn blue
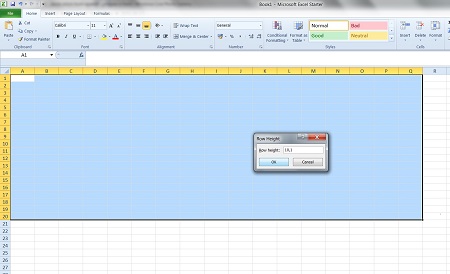
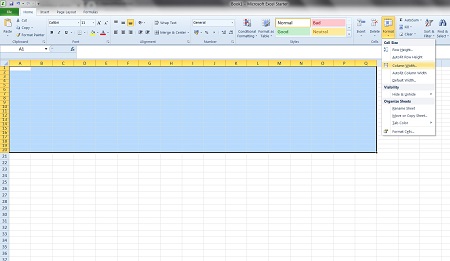
- click on “Format” and choose under “Cell size” the box “Row height”
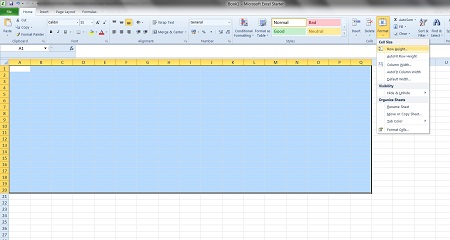
- a little window appears where you can change the default height
- fill in "10,1" and confirm
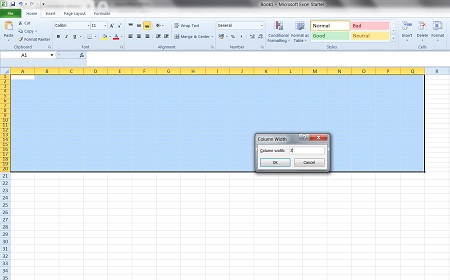
- click again on “Format” and choose “Column width”
- when the little window appears, fill in “2” and click “ok”
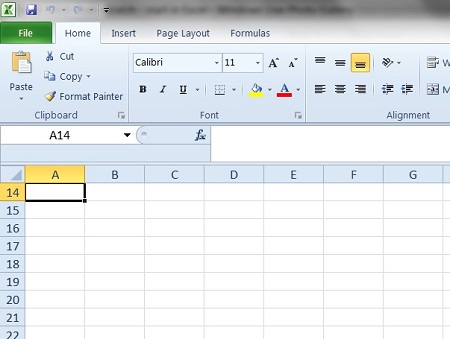
- click anywhere in your document and your empty graph will appear
- if necessary you can change more rows and columns later on by repeating the above
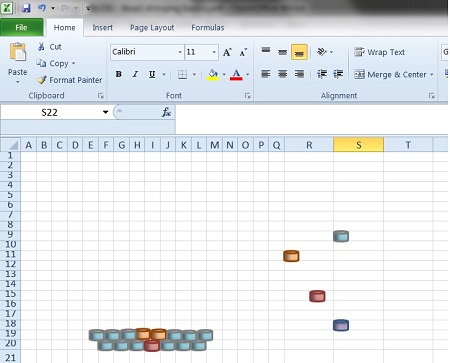
Creating fictitious beads:
- click on “Insert” which is next to “Home”
- click on “Shapes”
- and choose a “Can” shape under “Basic shapes”
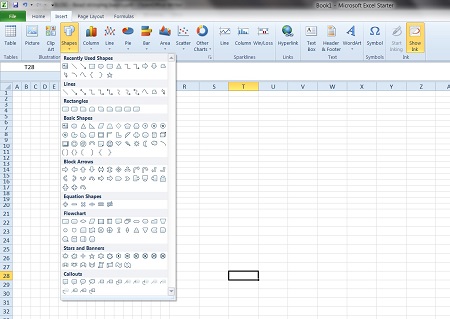
- click on the page and a cylindrical shape appears
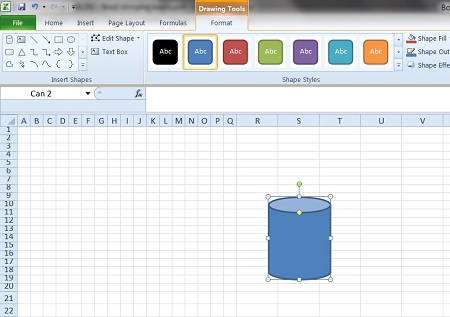
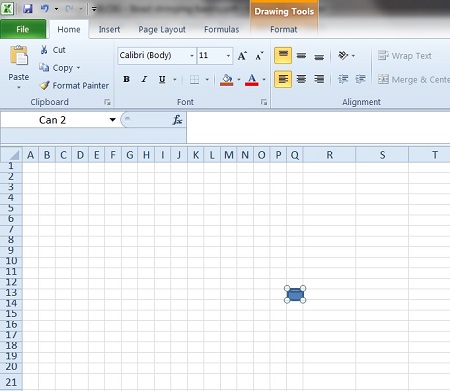
- to format the over-sized bead so it fits your graph: click on the cylinder and adapt its size by moving the cursors, first the side and then the top and bottom till it fits a cell
SEE- part 2